관리 메뉴

정보 전문가
[기후변화] 남극 얼음벽에 구멍을 낸 원인은 소용돌이, 서남극 스웨이츠 빙붕 녹이는 새로운 기작 세계 최초 제시 본문
320x100
반응형
남극 빙하가 사라지는 것을 막는 얼음벽이 무너지는 원인을 규명
s41467-024-47084-z.pdf
2.73MB
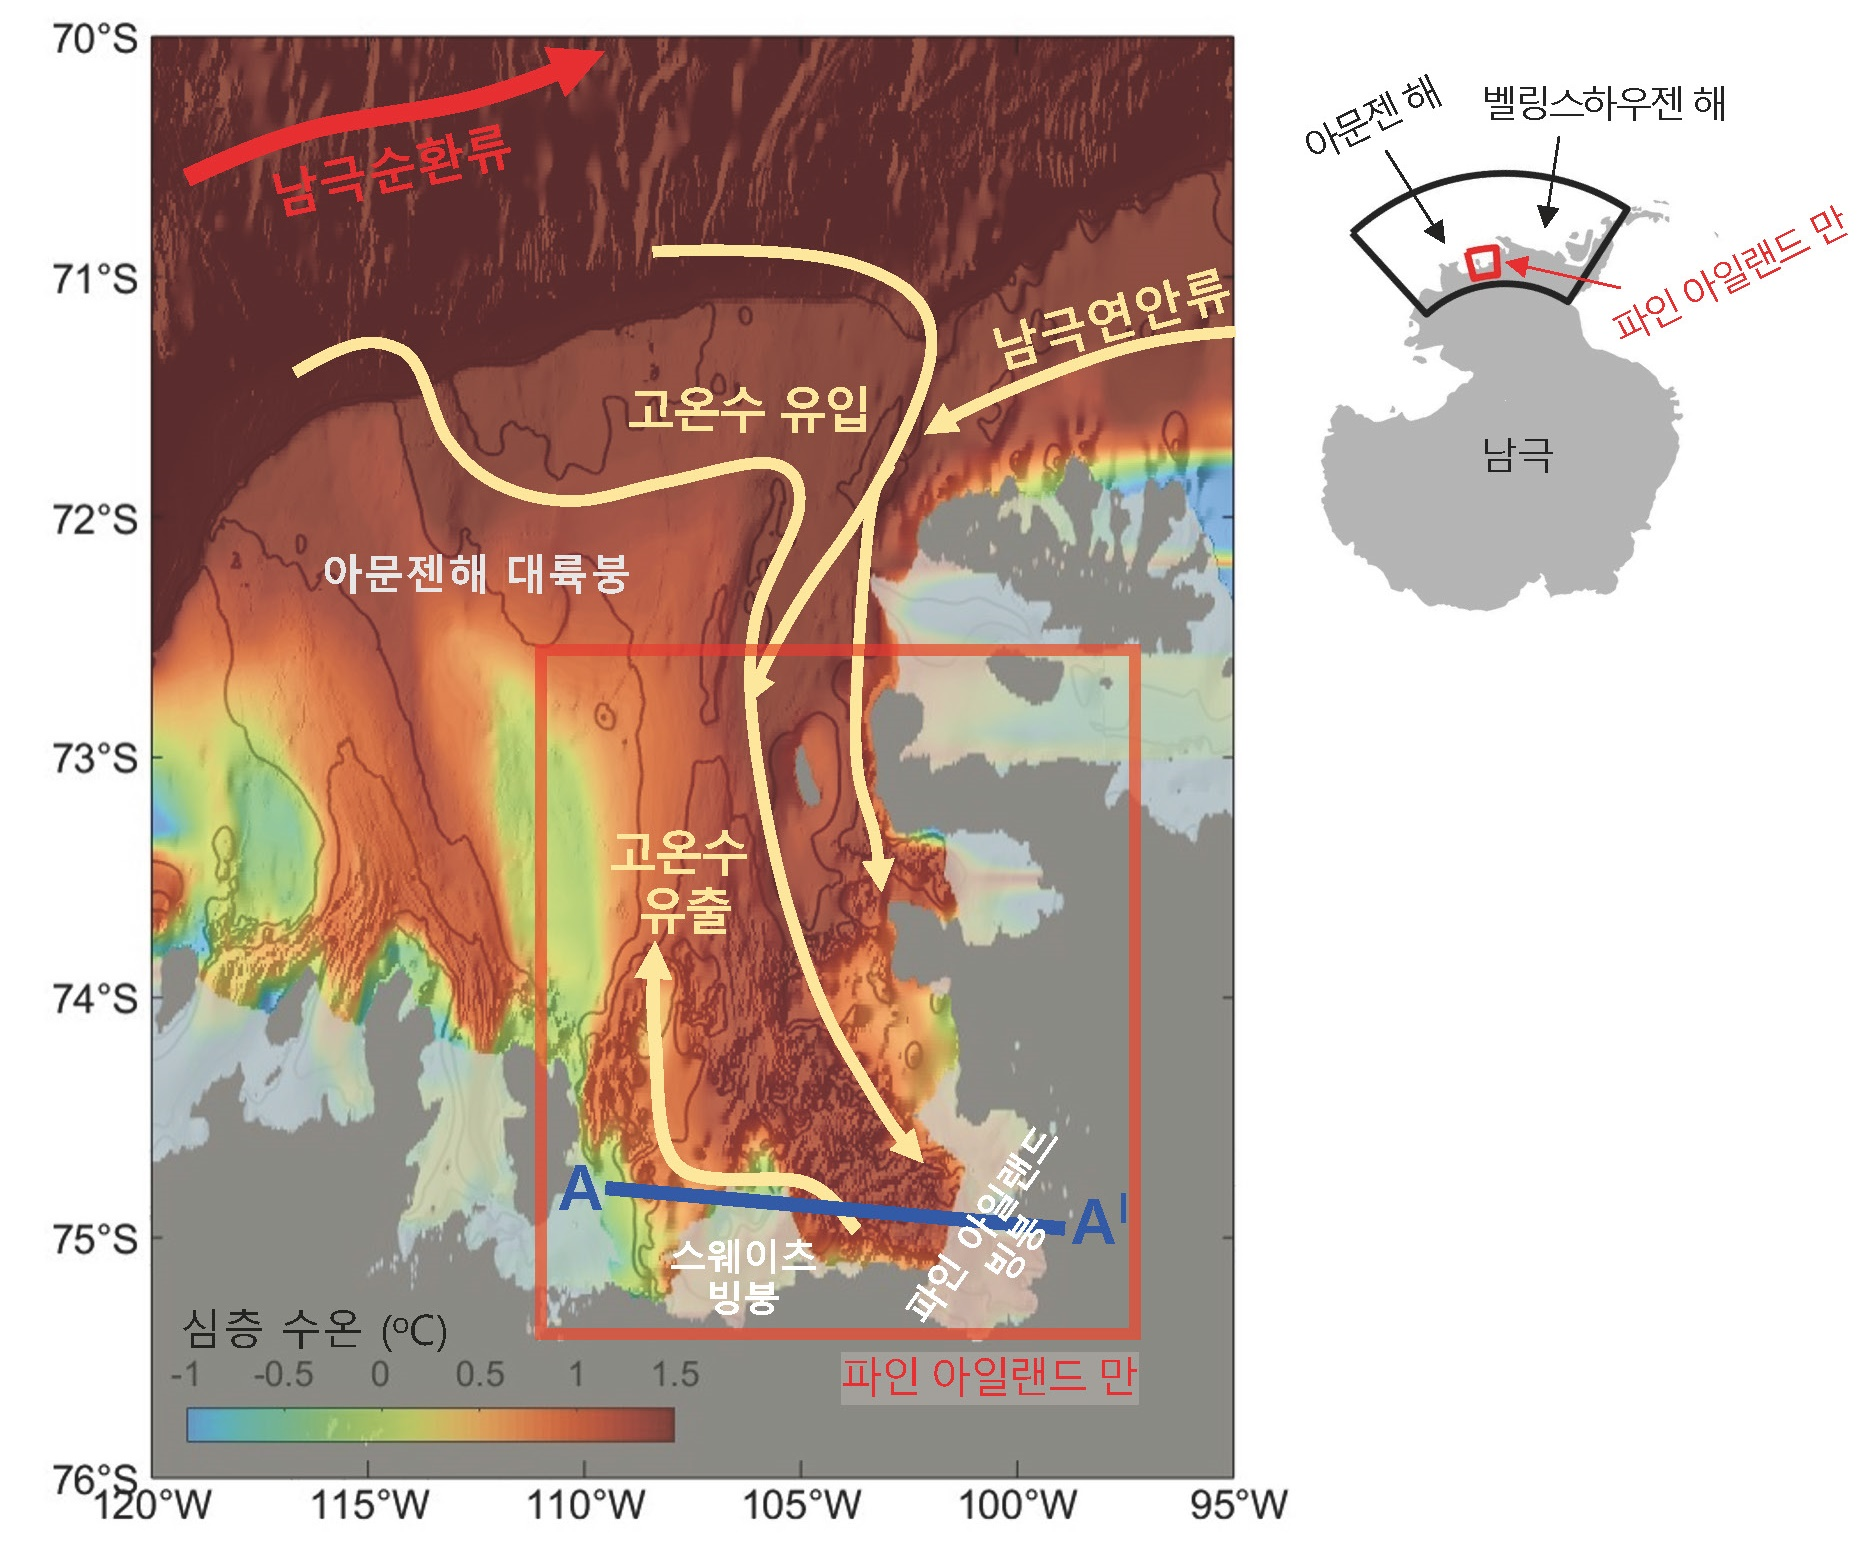
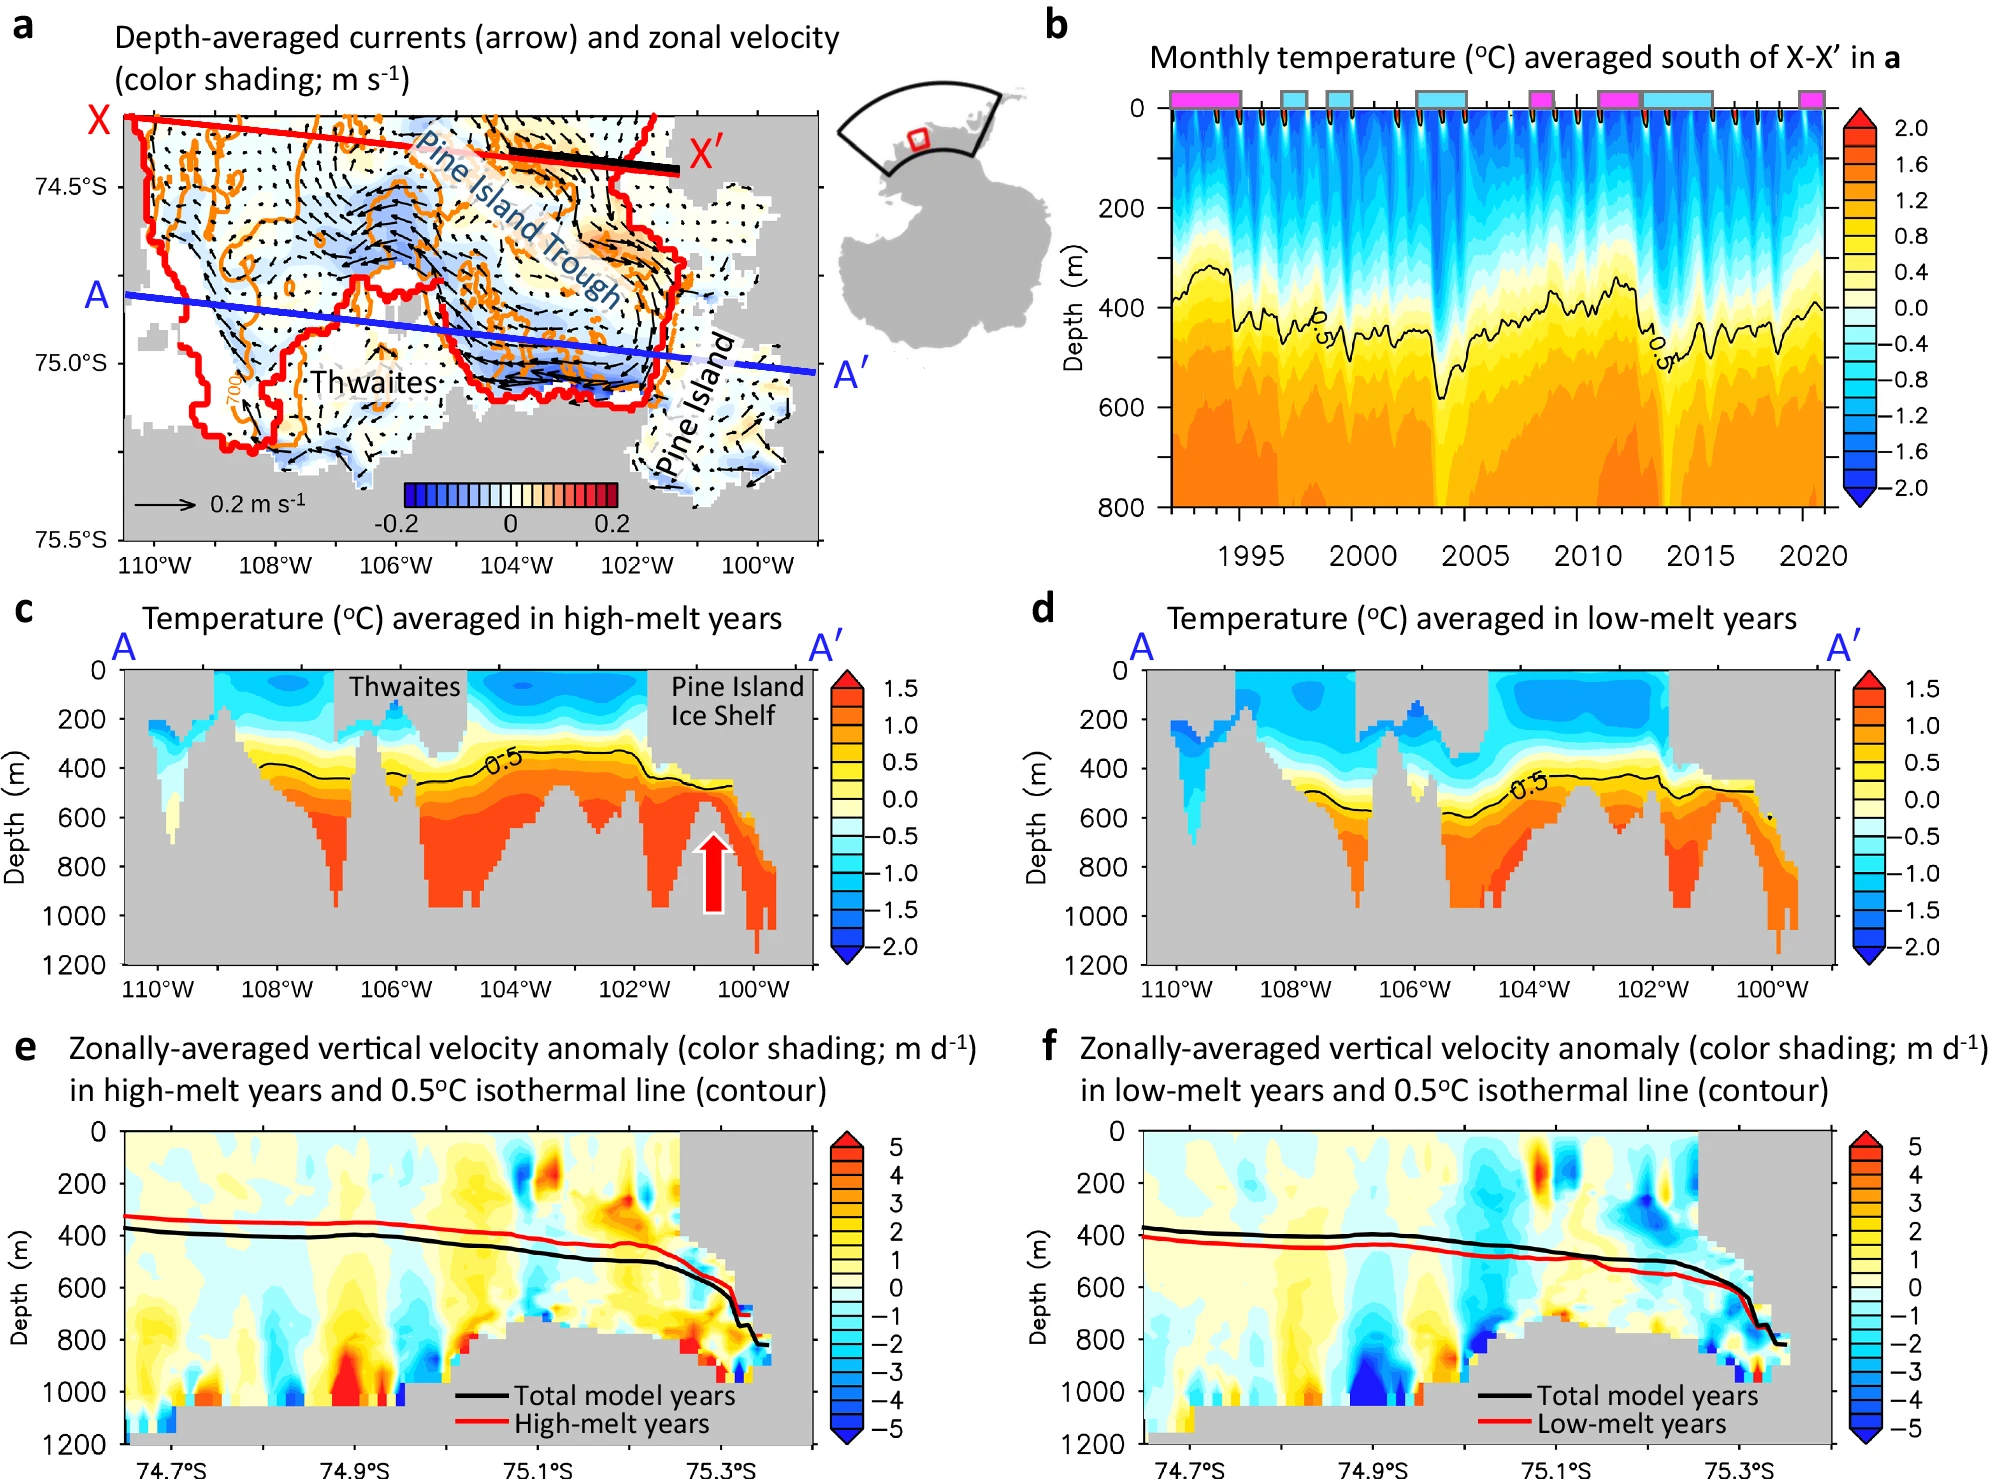
- 모델링을 통해 재현한 아문젠해 해류 모식도로, 해류의 방향(노란색 화살표), 심층의 따뜻한 수온(붉은 색상), 수심(500m, 700m를 검은색 선으로 표시)을 확인할 수 있다.
- 남극 연안으로 유입되는 심층 고온수는 빙붕을 녹일 수 있는, 수온이 0.5Cㅇ이상의 따뜻한 해수로 아문젠해 대륙붕으로 유입된다.
- 고온수가 계곡면을 따라 유입되고, 스웨이츠·파인 아일랜드 빙붕 부근에서 돌아 나가는 과정에서 소용돌이가 발생한다.(붉은 사각형 부분) 이 때 소용돌이의 용승 작용으로 심층의 고온수가 빙붕 하부 가까이 이동하게 된다.
□ 빙붕(ice shelf)은 빙하가 바다로 흘러 들어간 뒤에도 떨어지지 않고 빙하와 연결된 상태를 유지하는 수백 미터 두께의 ‘얼음벽’으로, 대륙 위 빙하가 바다로 유입되는 속도를 늦추고 외부에서 오는 따뜻한 바닷물을 막는 역할을 한다.
□ 서남극 아문젠해에 위치한 스웨이츠 빙하는 현재 남극에서 가장 빠르게 녹고 있으며, 스웨이츠 빙하를 보호하는 빙붕이 붕괴하면 스웨이츠 빙하는 물론, 주변 빙하 연쇄 붕괴로 이어질 수 있다. 서남극 빙하가 모두 녹으면 지구의 해수면은 약 5미터 상승한다고 알려져 있다.
□ 극지연구소 박태욱 박사와 일본 홋카이도 대학교, 서울대학교 국제 공동 연구팀은 바다를 컴퓨터로 재현하는 최신 해양 모델링 기법을 이용하여, 스웨이츠 빙붕을 녹이는 핵심 기작으로 해저에서 발생한 소용돌이를 지목했다. 북쪽에서 남극 연안으로 유입된 따뜻한 심층수를 소용돌이가 빙붕 하부로 올려보내 녹인 것이다.
□ 연구팀은 스웨이츠 빙붕 주변의 해저면이 빙하에 의해 깎인 계곡 형태를 보이는데, 해류가 이 위를 지날 때 지형의 영향을 받아 소용돌이가 발생한다고 설명했다.
□ 기존 연구들은 따뜻한 바닷물을 빙붕으로 유입시키는 원인으로 남극해 표층에 부는 강한 바람을 꼽았지만, 이번 연구에서 해류와 해저 지형의 상호작용이 빙붕에 따뜻한 물을 공급하는 가장 큰 원인으로 확인됐다.
□ 실제로 해류가 강했던 해에 빙붕이 더 빠르게 녹는 현상이 발생했는데, 유속이 빨라지면서 소용돌이가 강해졌고 고온수를 빙붕에 더 가깝게 상승시켰기 때문으로 분석됐다.
□ 이번 연구는 해양수산부 연구과제인 “급격한 남극 빙상 용융에 따른 근미래 전지구 해수면 상승 예측기술 개발"의 일환으로 수행됐으며, 국제 저명 학술지인 '네이쳐 커뮤니케이션즈(Nature Communications)' 4월호에 게재됐다.
□ 박태욱 극지연구소 책임연구원은 ”기후변화가 지구에 미치는 영향을 이해하는 과정에서 남극해는 핵심 고리이다. 이번에 확인한 스웨이츠 빙붕의 붕괴 기작을 바탕으로 남극의 미래를 예측하고 인류에 대한 위협에 대비할 수 있도록 관련 연구를 이어가겠다“고 전했다.
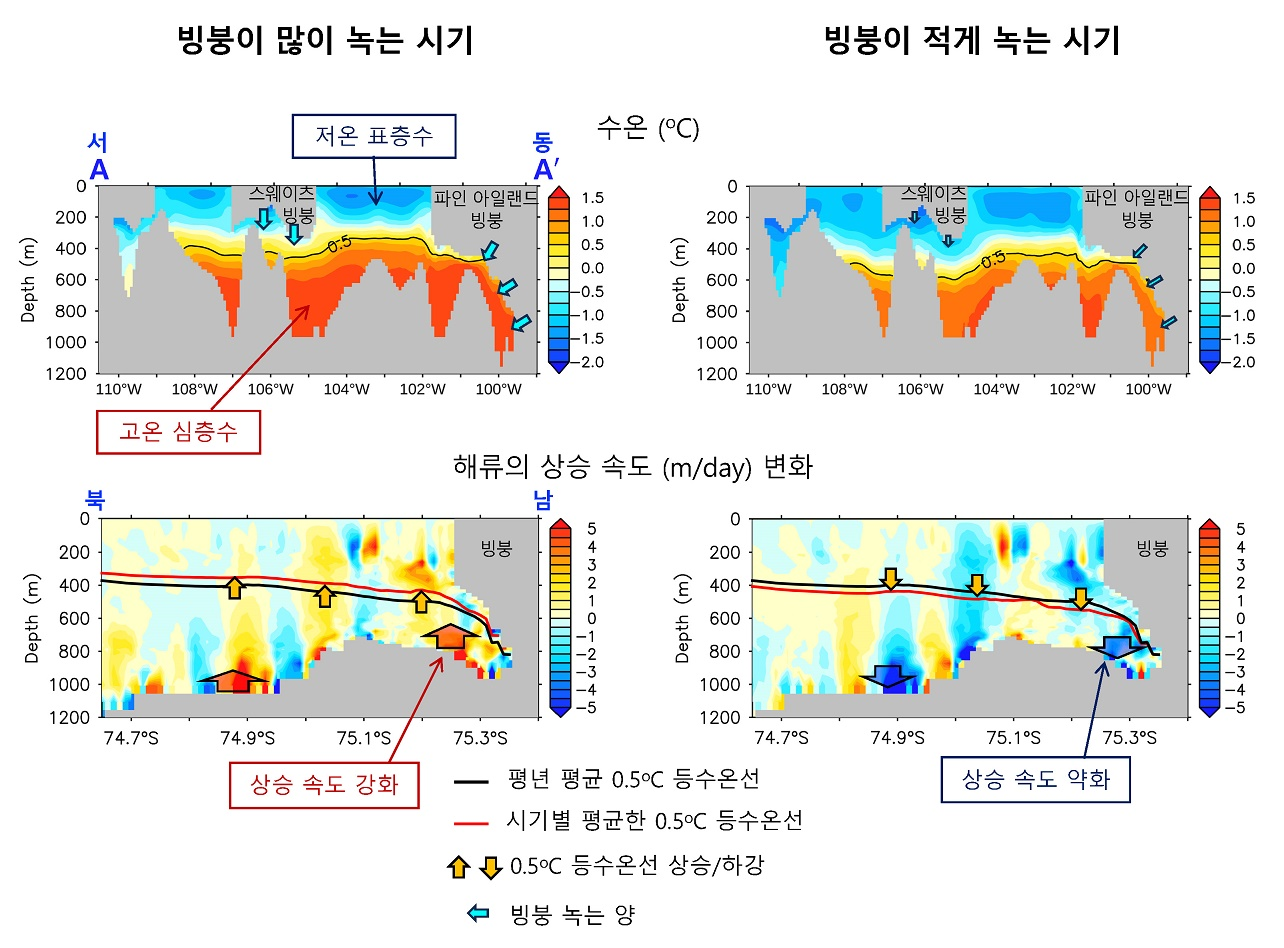
- A-A’ 부분 단면도에 빙붕이 많이 또는 적게 녹는 시기의 수온과 해류 속도를 병기한 그래프 이다.
- 빙붕이 많이 녹는 시기에는 유속이 높아, 고온 심층수가 빙붕 가까이 오르고, 그 결과 빙붕 하부의 수온이 오르는 반면, 적게 녹는 시기에는 유속이 낮아 고은 심층수가 적게 상승한다.
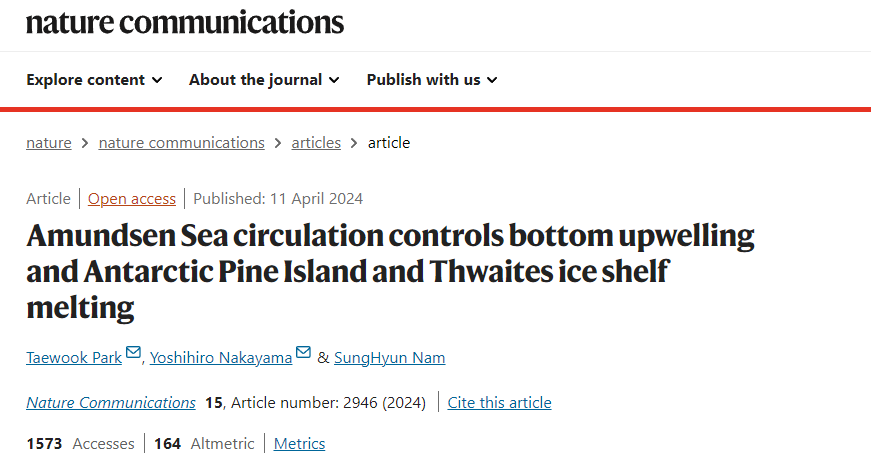
| Abstract The Pine Island and Thwaites Ice Shelves (PIIS/TIS) in the Amundsen Sea are melting rapidly and impacting global sea levels. The thermocline depth (TD) variability, the interface between cold Winter Water and warm modified Circumpolar Deep Water (mCDW), at the PIIS/TIS front strongly correlates with basal melt rates, but the drivers of its interannual variability remain uncertain. Here, using an ocean model, we propose that the strength of the eastern Amundsen Sea on-shelf circulation primarily controls TD variability and consequent PIIS/TIS melt rates. The TD variability occurs because the on-shelf circulation meanders following the submarine glacial trough, creating vertical velocity through bottom Ekman dynamics. We suggest that a strong or weak ocean circulation, possibly linked to remote winds in the Bellingshausen Sea, generates corresponding changes in bottom Ekman convergence, which modulates mCDW upwelling and TD variability. We show that interannual variability of off-shelf zonal winds has a minor effect on ocean heat intrusion into PIIS/TIS cavities, contrary to the widely accepted concept. |
728x90
'기상기후' 카테고리의 다른 글
| [기후변화] 기후변화 막는 게 훨씬 이익… 지구 기온 상승을 2도 제한하는 데 드는 비용보다 피해액이 6배. 2050년 전세계 GDP가 5분의 1 가까이 감소 전망 (89) | 2024.04.21 |
|---|---|
| [기후이슈] 1년 치 비 한꺼번에 쏟아진 두바이. 인공 강우 탓일까? 기후변화일까? (71) | 2024.04.18 |
| [기후변화] 엘니뇨 이후 가을쯤 라니냐 온다. 극단적 기상이변 예상 (67) | 2024.04.16 |
| [주말날씨] 이번 주말은 '초여름'…일요일 서울 낮기온 30도 육박 (62) | 2024.04.12 |
| [기후변화] 지구 온도 10개월 연속 최고. 지구촌, 미지의 새로운 재앙이 불어온다 (58) | 2024.04.12 |
'기상기후' Related Articles
more


